Gas lost or gas feared? Hormuz and the prospects for Europe’s gas market this winter
Crossing the Strait of Hormuz has become extraordinarily expensive. Tanker captains are being paid danger money and insurers are charging huge premiums for each voyage, the Financial Times reported this week. Since the war began on 28 February, at least 93 ships have been hit and 24 sailors killed. The attacks have intensified lately, with at least 14 since 20 September, one of the heaviest spells of the war, and transits through the strait have fallen to their lowest since late July, according to Reuters. Oil can partly go round the strait, through exports rerouted via the Gulf of Oman and the Red Sea. However, gas cannot: Qatar’s cargoes of liquefied natural gas (LNG) have to pass through it.
In Europe, the gas price has climbed with the risk. The Dutch TTF contract for delivery next month closed at €81 per MWh on Friday 9 October, two and a half times its level on the eve of the war (€32 on 27 February) and a third above its March peak. Much of the climb is recent: the monthly average rose 40% between July (€54) and September (€75). The price is still far below its record monthly average, €235 in August 2022, but low storage in Europe, together with the damage that Iranian strikes did in March to Qatar’s Ras Laffan complex, which according to QatarEnergy has taken about a sixth of its LNG export capacity out of service for three to five years, feeds fears of a lasting disruption of LNG supplies to Europe. So is Europe paying for gas it has lost, or for gas it fears losing?
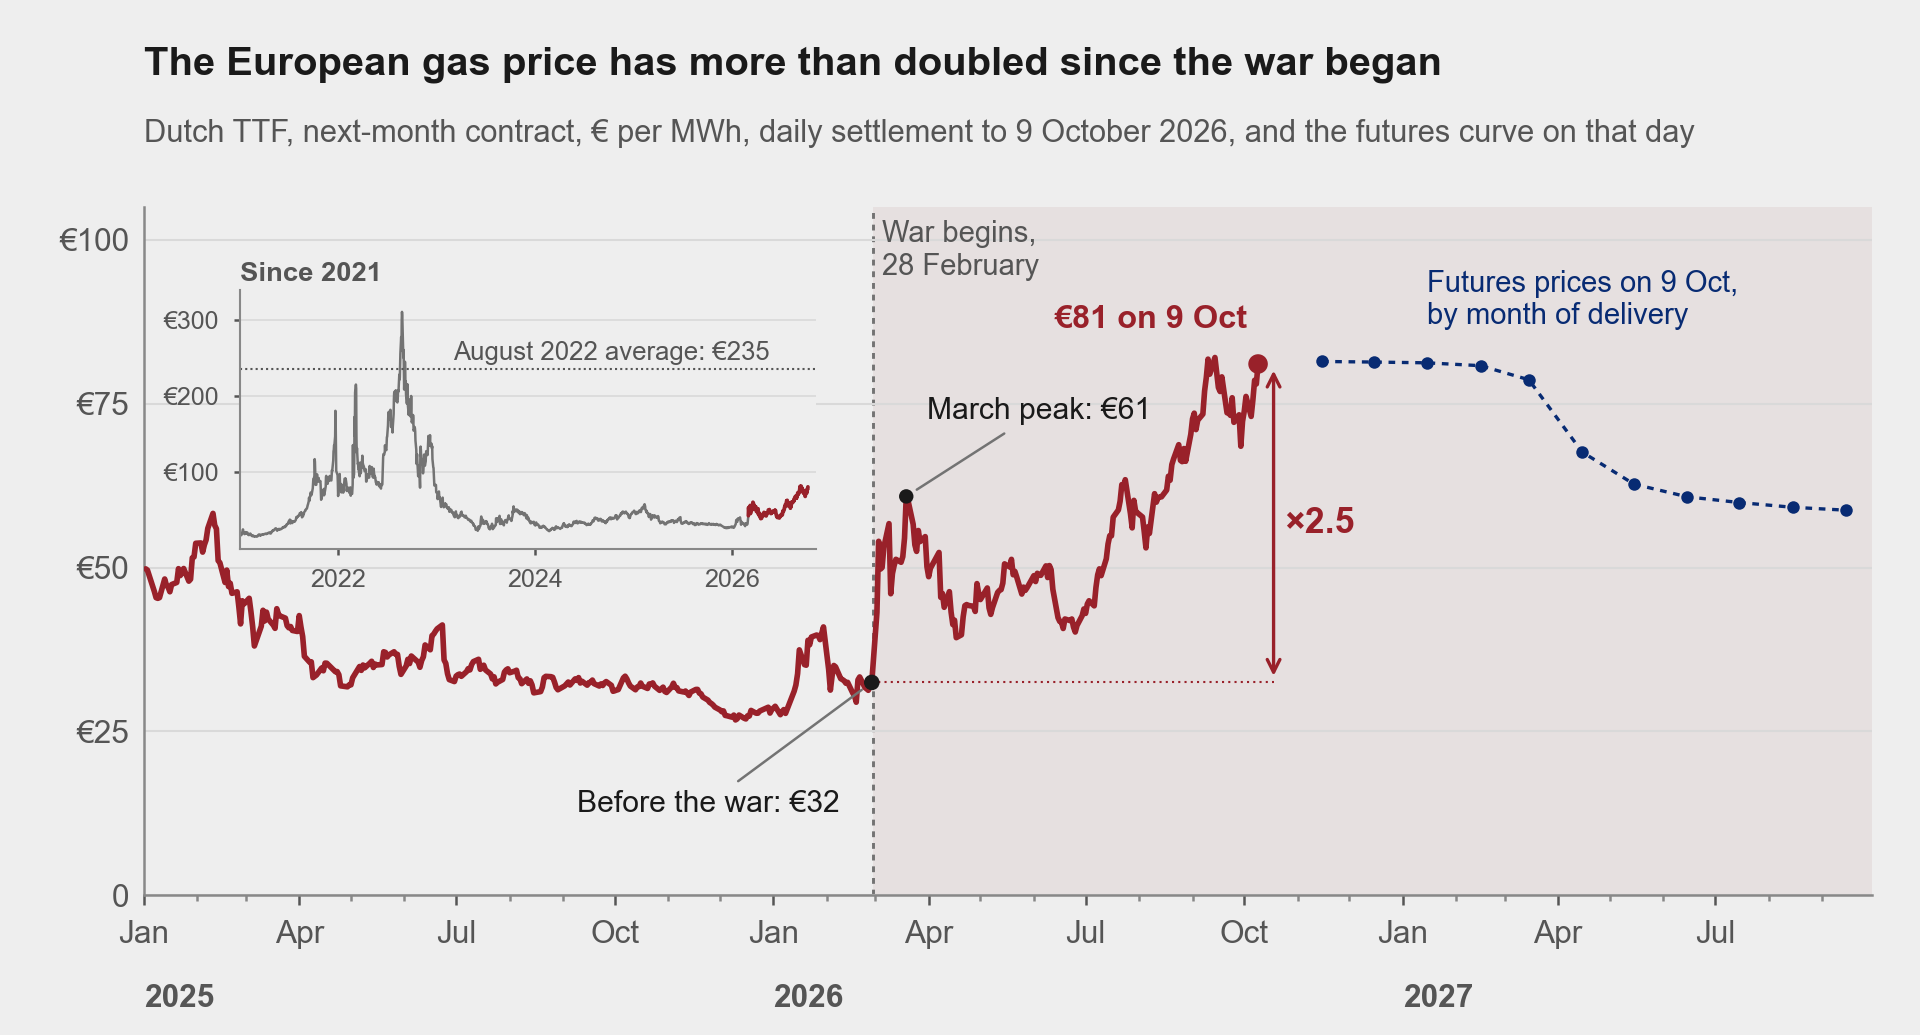
In short
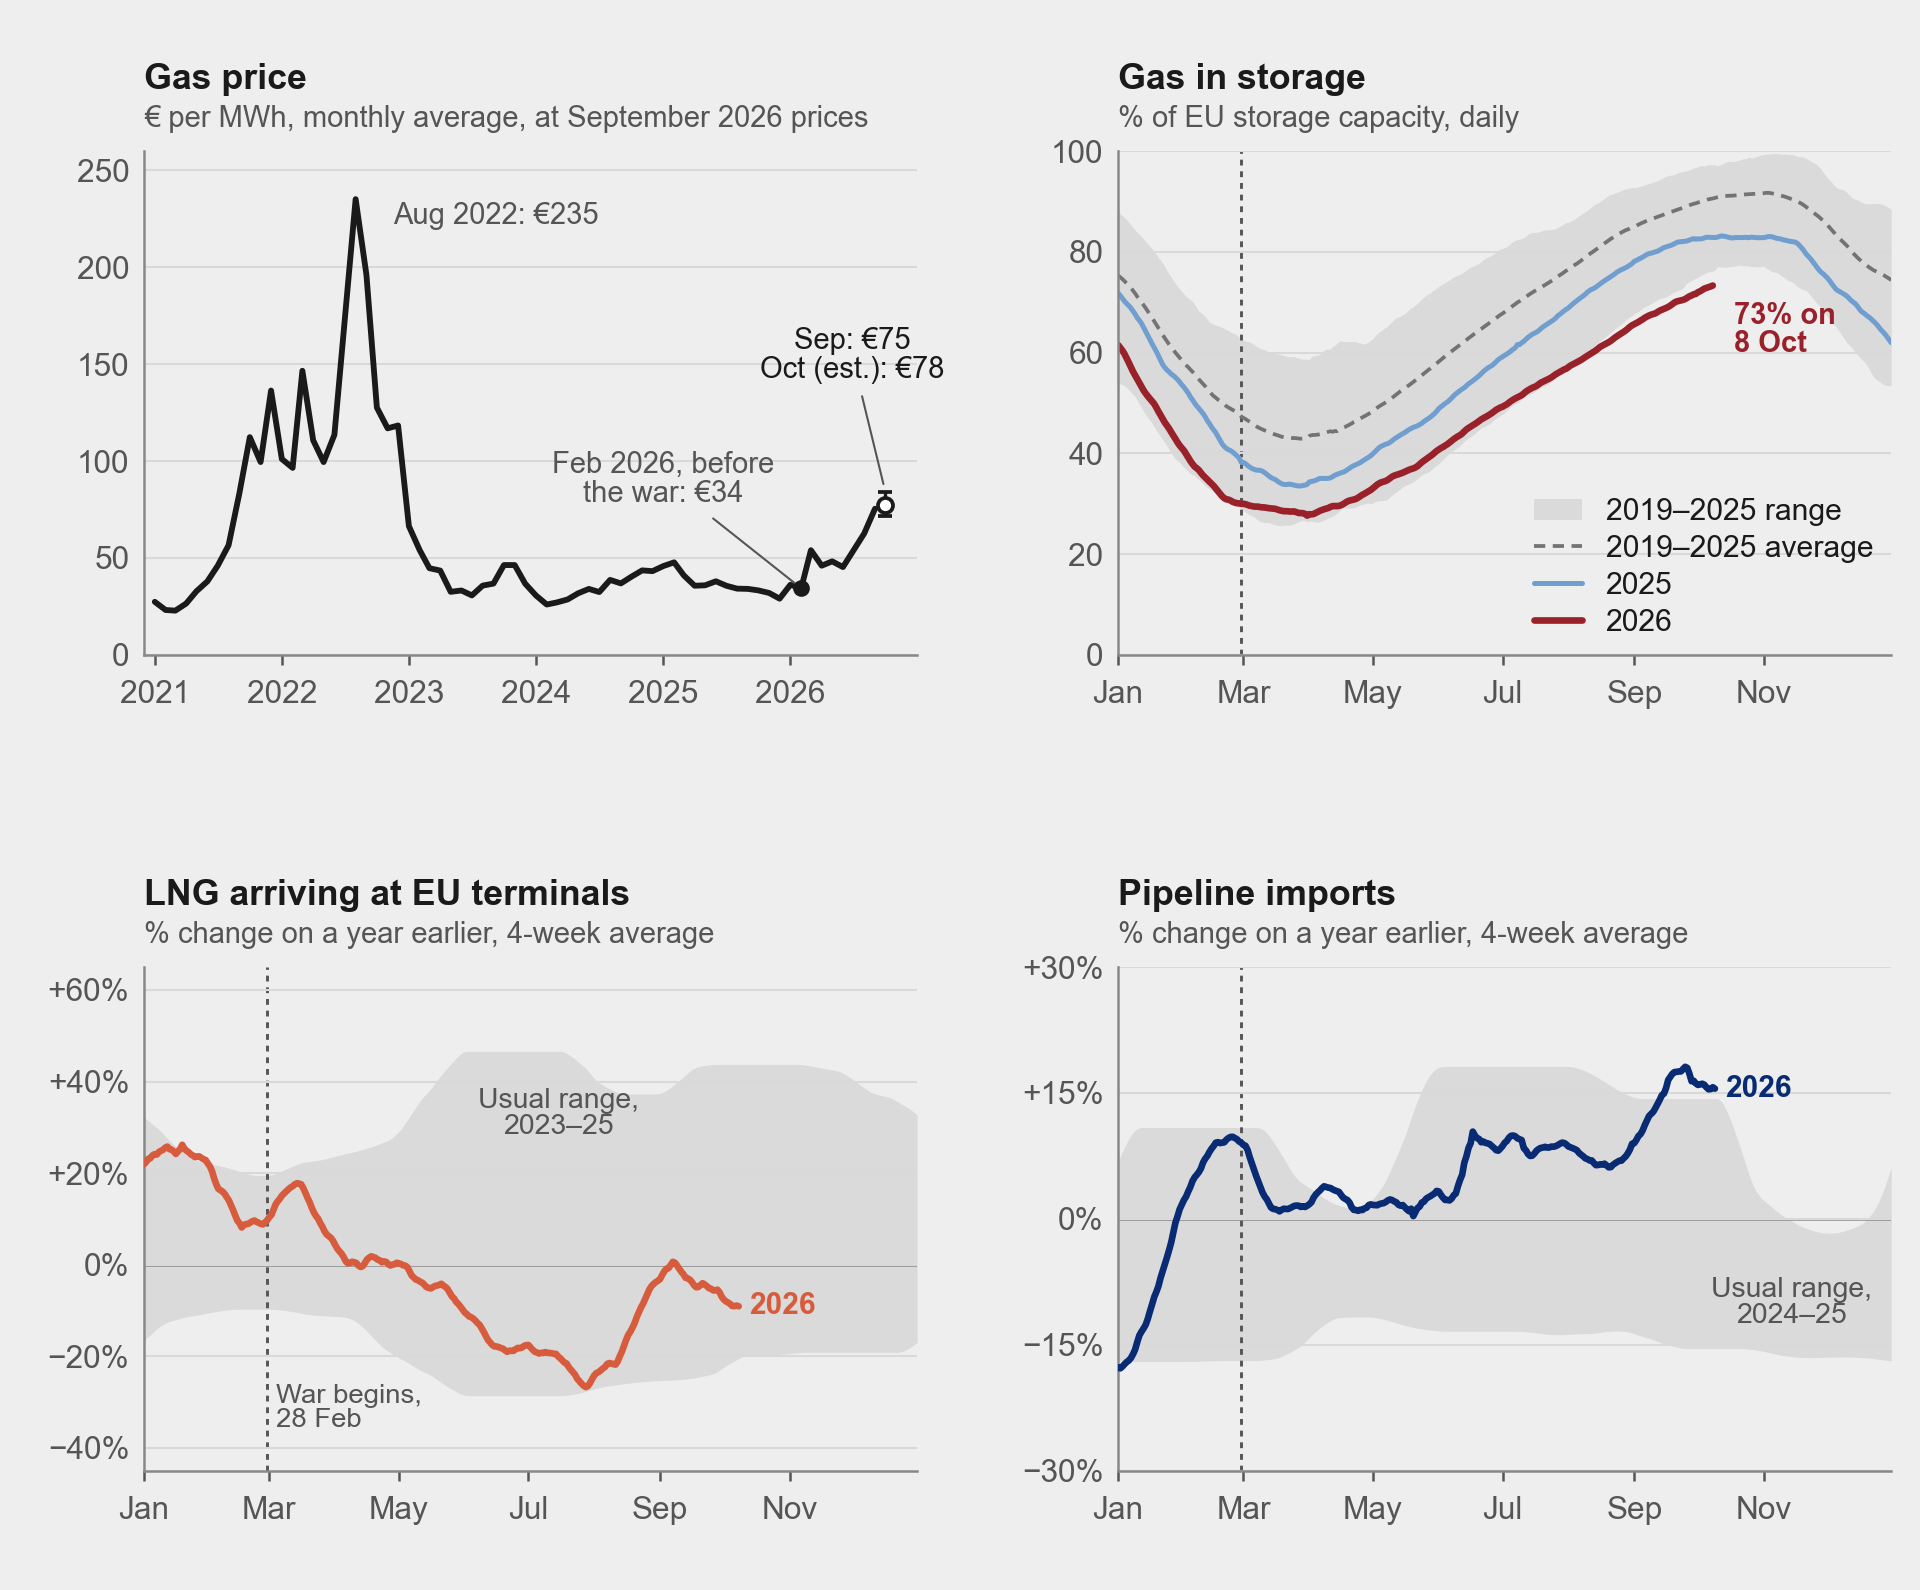
- Gas is still reaching Europe, but storage is much lower than in a normal year: 73% full on 8 October, against 91% on average in 2019 to 2025.
- Most of the recent rise reflects precautionary demand rather than missing gas. Of the 40% increase between July and September, the model attributes about 90% to buyers storing gas against a possible shortage, and the first week of October points the same way: the precautionary premium is still in the price. September’s surge in precautionary demand was as large as in August 2022, at the height of the Russian gas crisis.
- If the stalemate continues, with another round of precautionary buying like that of August and September, the model puts the price at about €130 per MWh at the start of 2027. A reopening of the strait would bring it back to about €64, while a severe return to war would probably push it above its August 2022 average of €235.
- Reading prediction markets, I put the probability of a reopening at about 15%, of a frozen conflict at about 65% and of a return to full-scale war at about 20%. Weighting the model’s scenarios with these probabilities, there is a probability of about 17% that the monthly gas price reaches its August 2022 average at some point between October 2026 and March 2027 (9% to 25% with other plausible weights). The figure depends on how severe a war would be: with a milder one it falls to about 8%. Gas futures, however, point to a calmer winter.
Why do we need a model?
Prices and quantities push on each other, so the raw series of volumes and prices alone cannot say whether the price rose because gas went missing or because demand rose. This note uses a structural model of the European gas market (paper) that estimates how suppliers, consumers and the firms that fill storage respond to the price, and from that recovers the supply and demand “surprises” or “shocks” behind each month’s data.
Telling supply shocks from demand shocks speaks to the current debate, physical disruption or expectations, and lets us simulate what different paths for the conflict would do to the price. Each scenario is built from thousands of simulations of the model, which give a range as well as a central value.
Where things stand
Start with the physical side. LNG arrivals at EU terminals fell steadily from April and in July were about a quarter below the year before. They recovered, however, in August and September to within 5 to 10% of last year, though early October is running about a tenth below. On the other side, pipeline imports, mostly from Norway, are about 16% above last year, making up for most of the shortfall in LNG. What is worrying is storage: inventories were at 73% of capacity on 8 October, against 91% on average in 2019 to 2025. And despite paying far more for the gas, Europe has been filling them faster than usual. In September, net injections averaged 2.4 TWh a day, against 1.8 on average in 2019 to 2025, and in the first week of October 2.2 against 1.4, although storage also had more room to fill than usual.
The model splits the rise of the price above its pre-war level into its drivers. In September the price was about €41 per MWh above February’s €34. Precautionary demand, gas bought to store because buyers expect a shortage, accounted for about €22 of that and LNG cargoes that did not arrive for about €12, while strong pipeline flows took off about €6; the rest is mostly momentum the price already had before the war. When the strait closed in March, precautionary demand did most of the work (about €15 of a €20 rise) while LNG was still arriving.
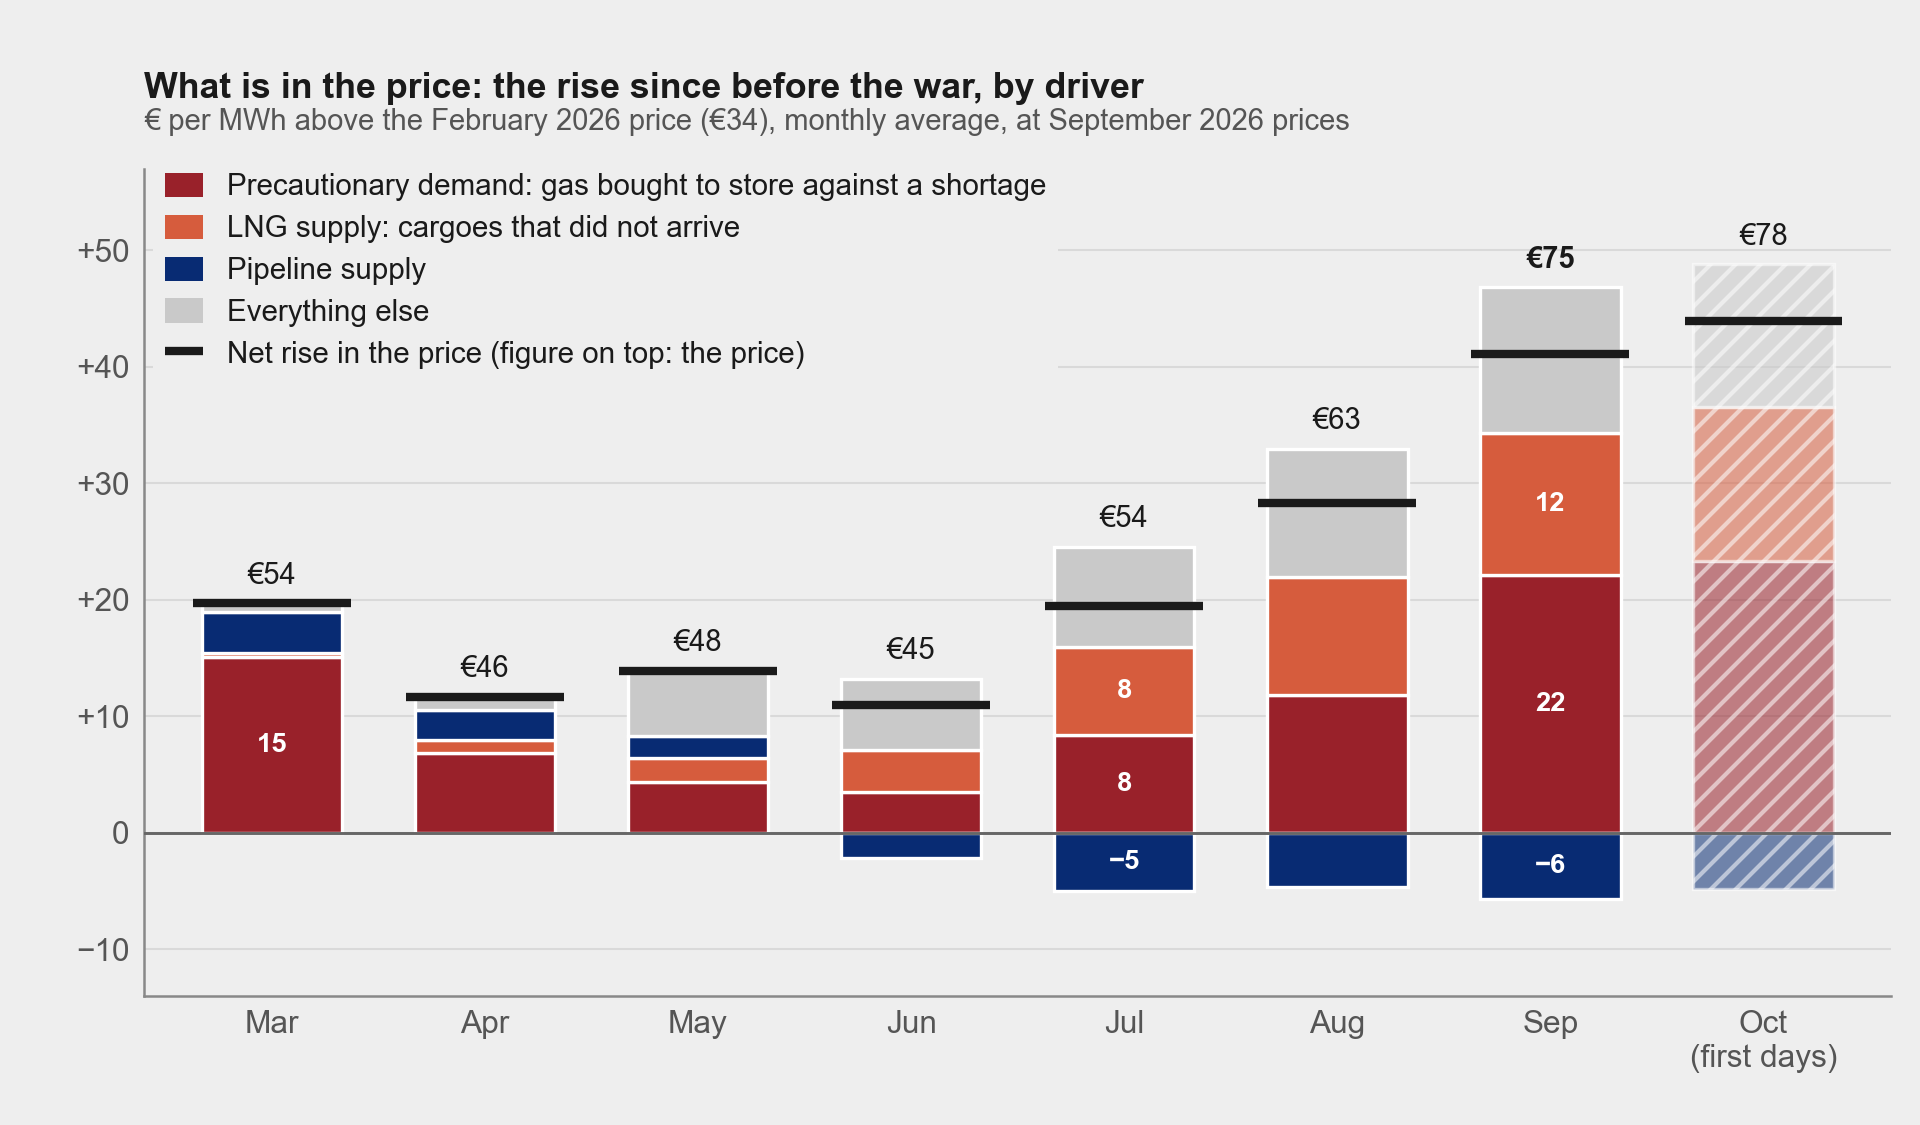
Between July and September the price rose by €21, or 40%. About €19 of that, nine tenths, came from new precautionary buying. Pipeline flows and other factors added about €4, and LNG took about €2 off, because cargoes came back faster than the model expected.
September’s surge in precautionary demand was as large as that of August 2022, at the height of the Russian gas crisis, and more than half the size of March’s, when the strait closed. But the market was not short of gas in September; it was buying gas to hold against a winter in which it might be.
October is a first read, from about a week of data. The price dipped at the end of September (the month averaged €75), then rose through the week of attacks, from €72 on 30 September to €81 on Friday. Even so, if it held at €81 for the rest of the month, October’s average would be only a few percent above September’s. The model already expected a rise of about 8% in October, from the shocks of earlier months still working through, so the first week of October has not added new pressure on the price. Storage kept filling fast and the first days of October were unusually warm, so for now the model reads early October as weak demand for gas to burn rather than new precautionary buying. If injections slow as the weather turns, that reading could change. Either way, none of the premium from the precautionary buying of August and September has left the price: it is still worth about €20 to €22 per MWh.
What could come next
Where the price goes depends on the strait, and few expect it to reopen soon (more below). The model’s three scenarios add new shocks to LNG supply and to precautionary demand from October to February. The kind of scenario sets the direction and timing of the new surges in precautionary demand; their size is taken from what we have seen this year:
- Reopening: the strait reopens, cargoes return and precautionary buying unwinds by the end of the year.
- Frozen conflict: the stalemate drags on, some cargoes keep missing and precautionary demand rises a little each month until January; in all, about another round like August and September.
- War: a return to full-scale war. Precautionary demand surges as much as it did in March, in October and again in November, and keeps rising more slowly until February, while more cargoes are lost.
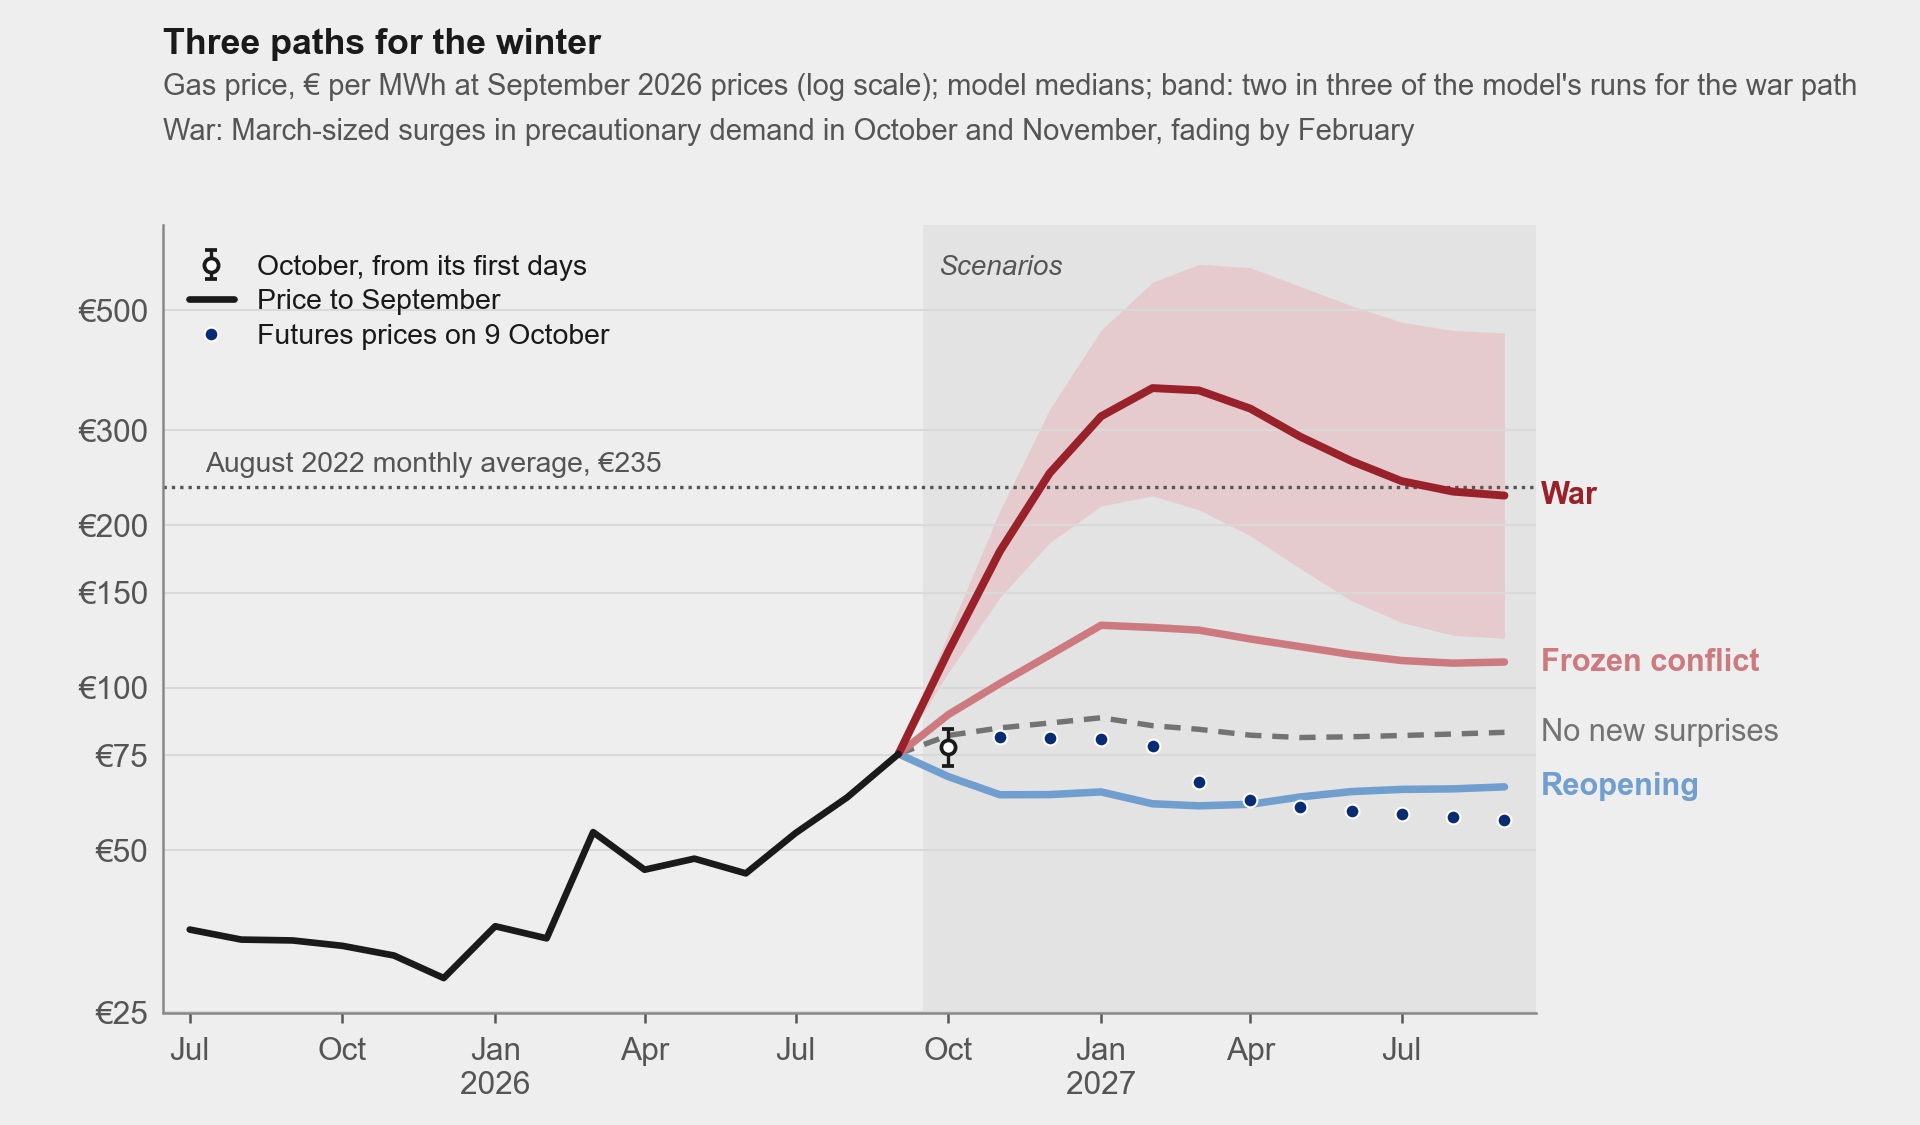
With no new surprises, the price still drifts up to about €88 in January: about half of that drift is the delayed effect of the cargoes lost in the spring and in July, and about a quarter is the precautionary buying of August and September still working through. A reopening brings the price back to about €64 in January, a frozen conflict lifts it to about €130 and keeps it there through March, and the war path takes it to about €318 in January and €359 in February, above the August 2022 average in about 80% of runs.
The war path is severe by construction: it stacks two March-sized surges and then three smaller ones. A milder war, with a March-sized surge in October only, would lift the price to about €138 in January, close to the frozen conflict, and would reach the 2022 level in only 3% of runs. Two such months would take it to about €200, above the 2022 level in about 37% of runs. And if the new surges were only as large as those of August and September, less than half of March’s, every path would be milder: the war path would reach about €157 in January.
In the war path, precautionary demand does nearly all the work: about 94% of its extra rise. With the cargo losses alone, the price in January would be about €93, barely above the path with no new surprises. Even with cargo losses as large as July’s, the biggest shortfall so far, the cargoes alone would lift the price to about €114 in January, and they would explain only about a fifth of the war path’s rise. Lost cargoes move the price slowly and modestly, but the precautionary buying that comes with them moves it a lot and at once.
What prediction markets say
On prediction markets such as Polymarket and Kalshi people bet on events, and prices can be read as probabilities. The most traded Hormuz contracts pay out if shipping is back to normal: a seven-day average of at least 60 ships a day, of all kinds and not only LNG carriers, on the IMF’s PortWatch tracker. In 2023 to 2025 about 90 a day went through; since March, mostly under 10, apart from a partial reopening in late June and early July that peaked at 32.
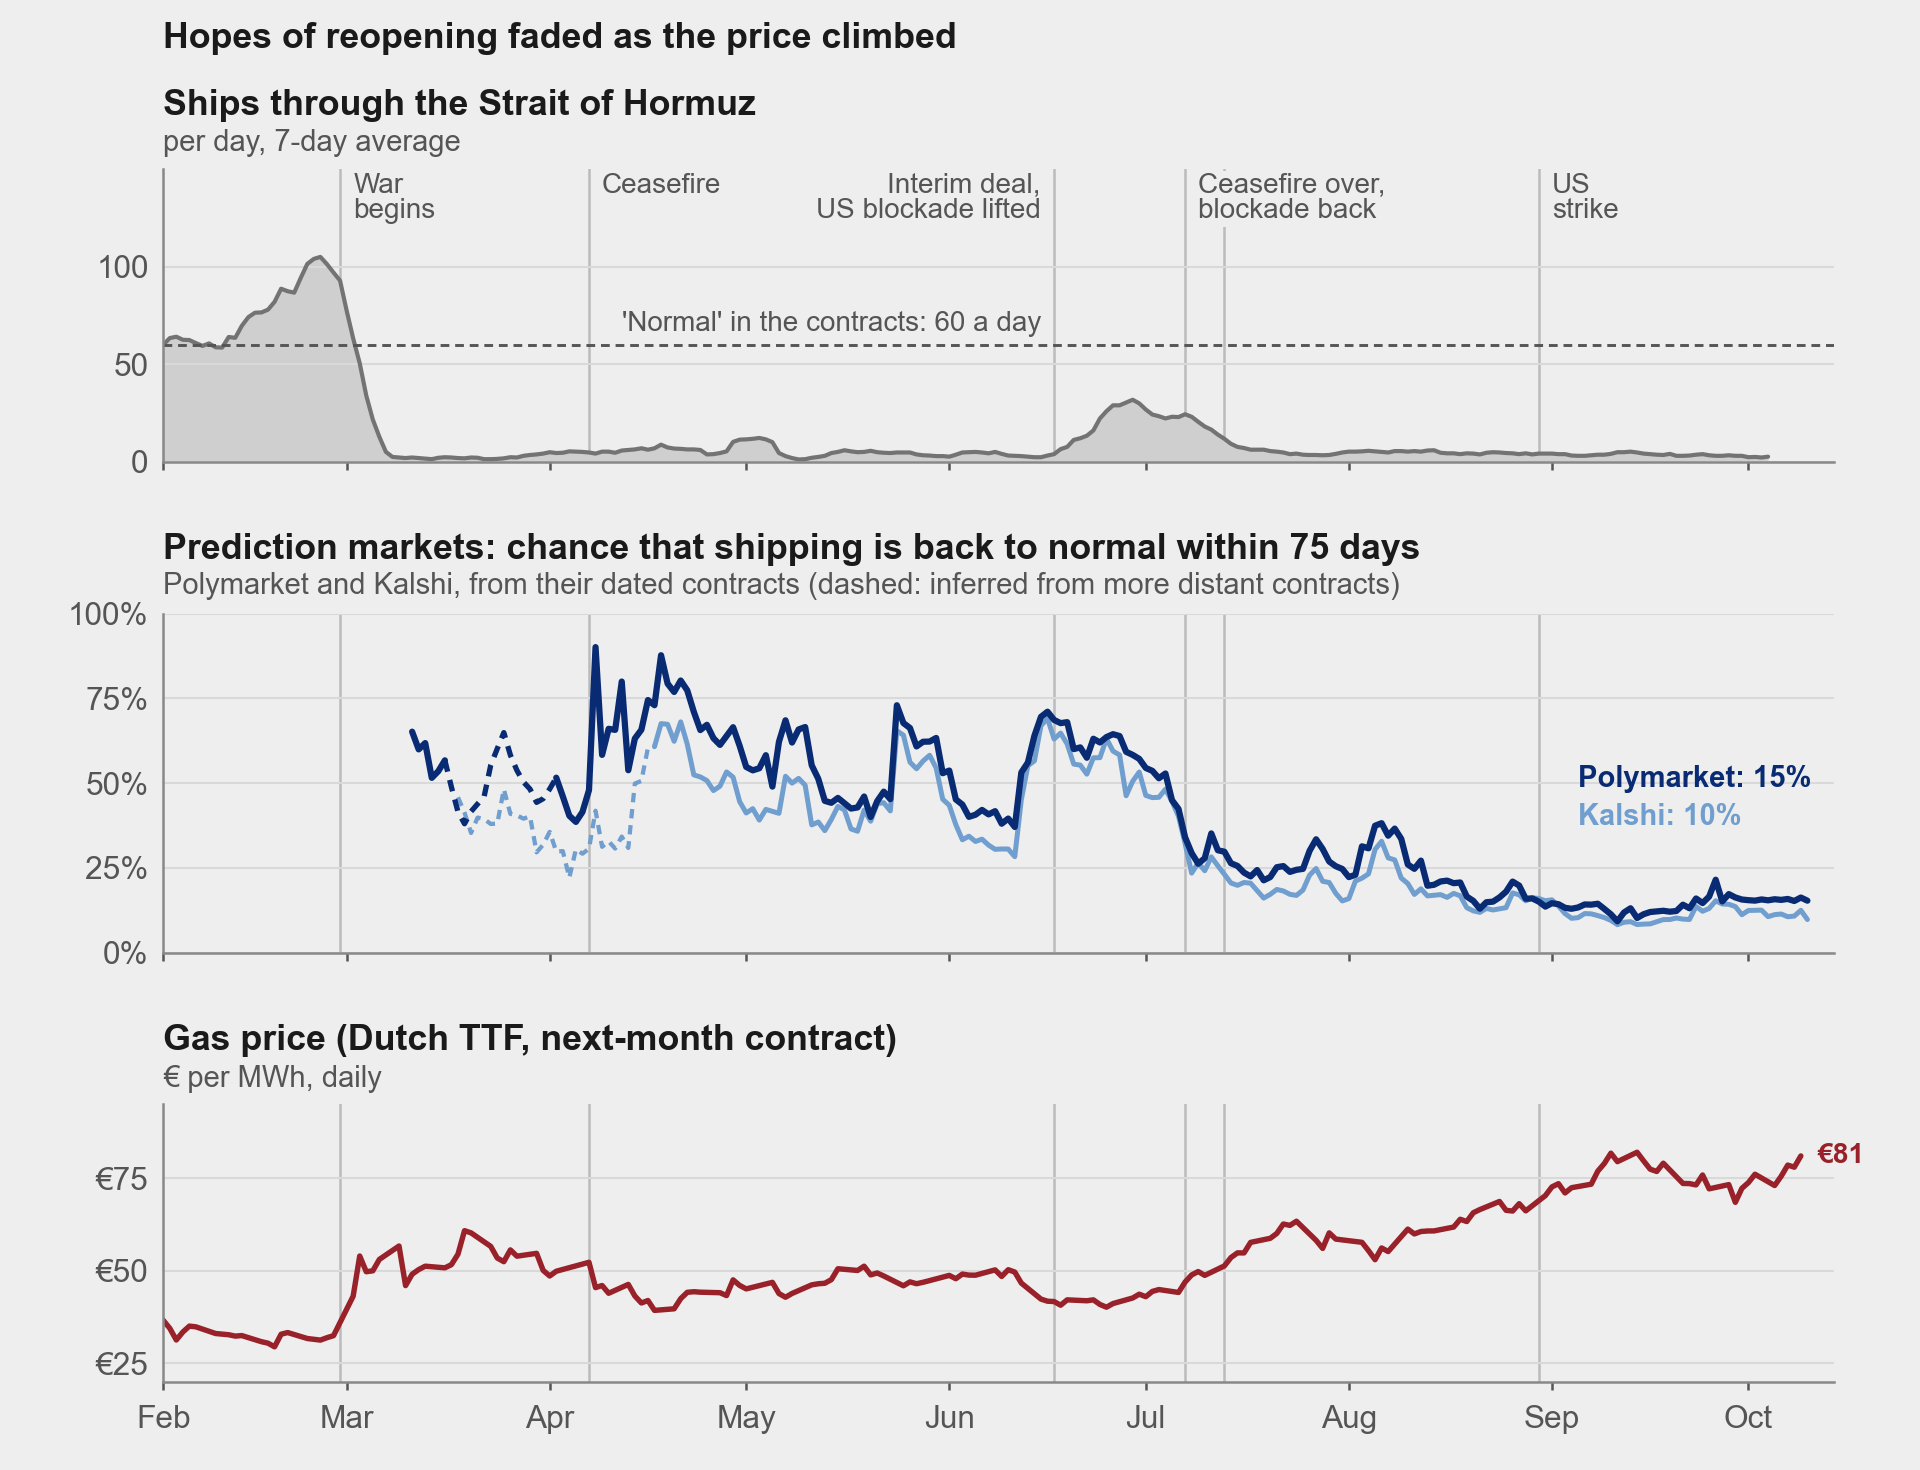
In the spring the markets expected a reopening. After the April ceasefire, the chance of normal traffic within 75 days reached 80 to 88% on Polymarket and 60 to 70% on Kalshi, and it was back near 70% in late May and in mid-June, when the US and Iran announced an interim agreement. It collapsed in early July, when the US struck more than 80 targets in Iran and declared the ceasefire over (7 July), then reinstated its naval blockade (13 July), and it fell again after a US strike at the end of August, to 10 to 15% today. On average, each ten-point weekly fall in those odds came with a rise of about 5% in the gas price. Both react to the same news, so this proves nothing on its own, but it fits a price driven by precautionary demand: since late July, the cargoes have been coming back.
For the rest of the year, the markets give:
- Strait back to normal: 18% on Polymarket, 12% on Kalshi (about 30% by the end of March 2027).
- A new US strike on Iranian territory: about 67%, mostly after the US midterm elections of 3 November.
- Signs of full-scale war: Iran closing its airspace 23%, a US ground offensive 17%, the Bab el-Mandeb strait closed 16%.
- Steps towards peace: the US ending its naval blockade 42%, a US-Iran deal on Hormuz traffic 36%.
Read together, these markets suggest probabilities for the three paths. Another round of strikes like late August’s is what the frozen conflict looks like, so it takes most of the weight, about 65%. A return to full-scale war gets about 20%, and a reopening about 15%. These weights are my reading of the markets, and the ranges around them are wide.
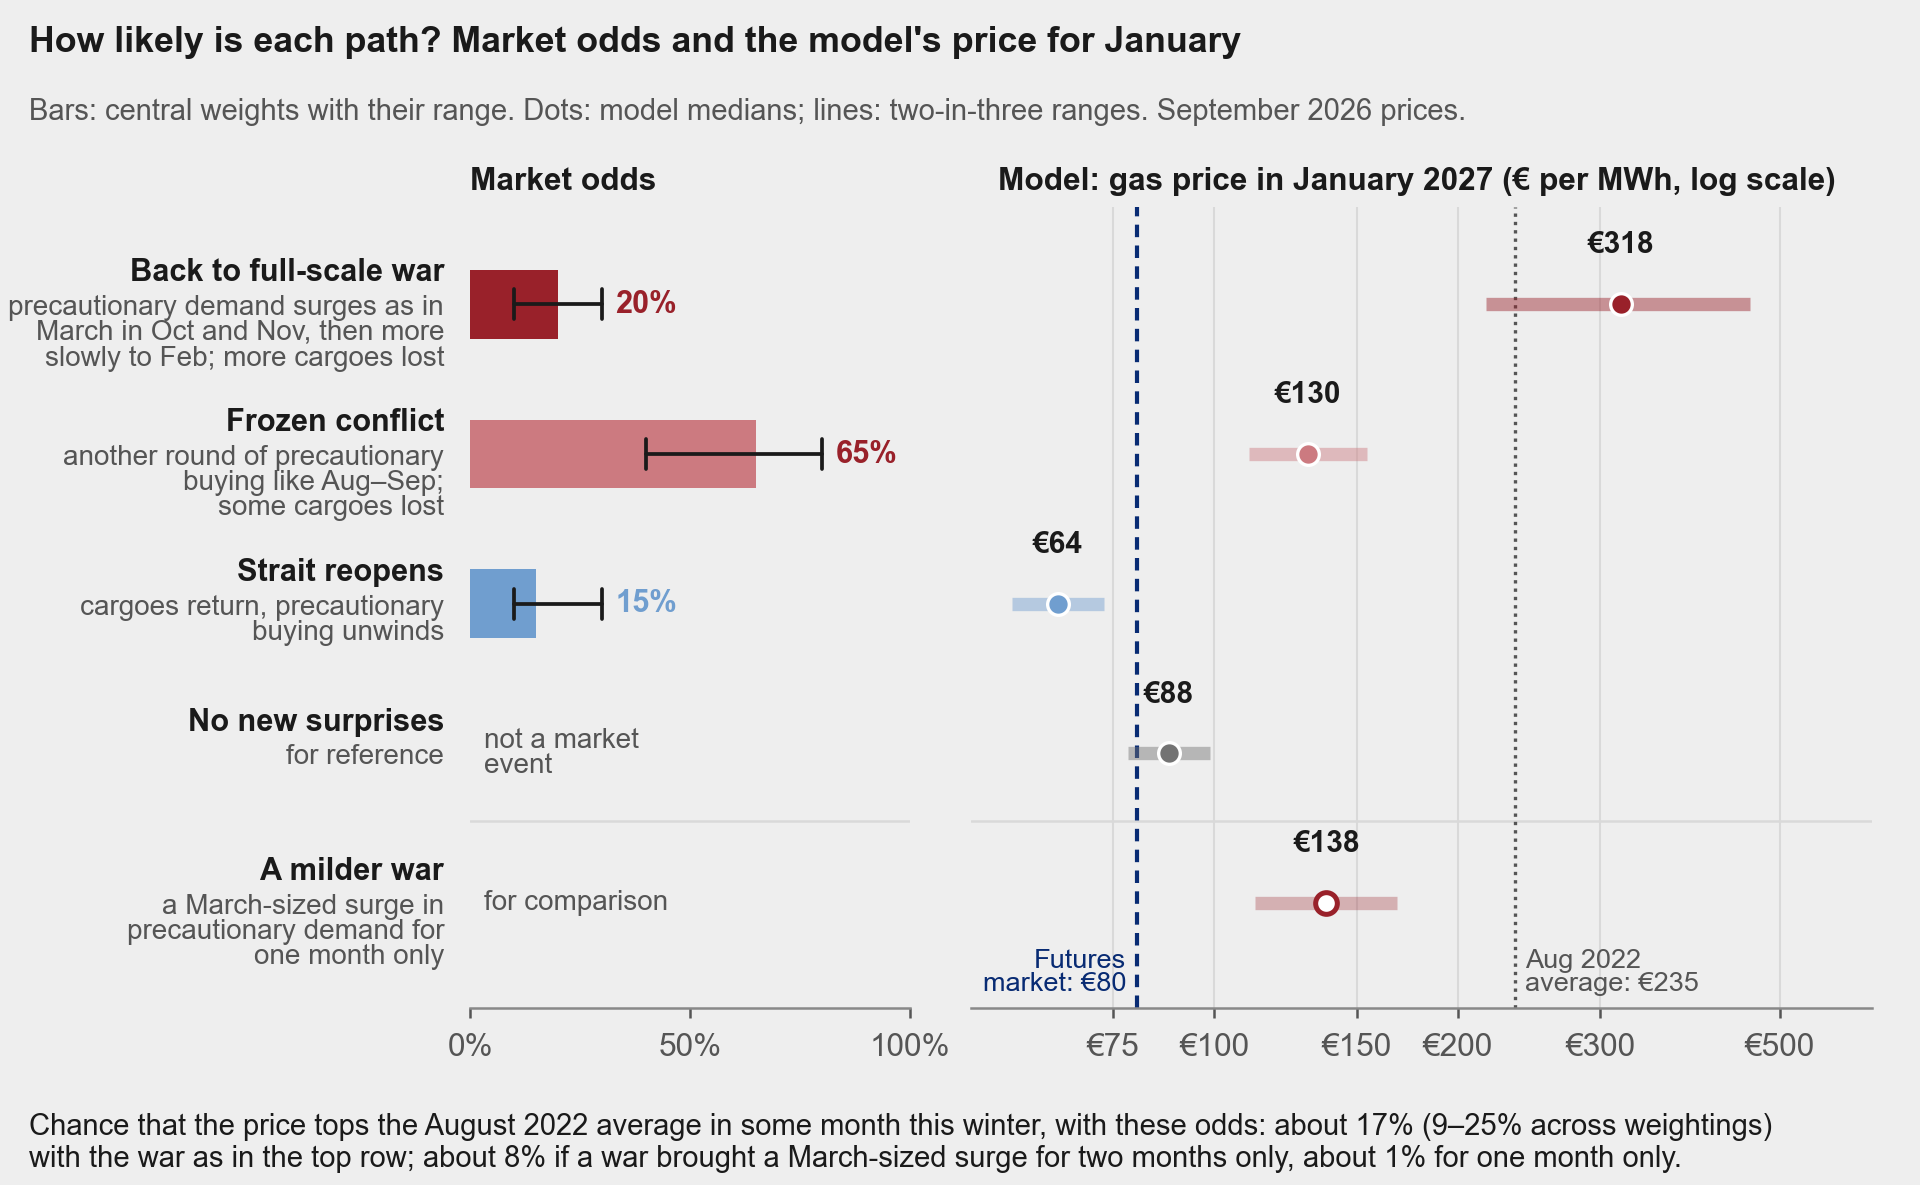
Weighting the model’s scenarios with these probabilities gives a probability of about 17% (9% to 25% with other weights) that the monthly gas price reaches its August 2022 average at some point between October 2026 and March 2027. Almost all of that probability comes from the war path, so it depends on how bad a war would be. If a new war brought a March-sized surge in precautionary demand for two months and then stopped, the probability would be about 8%; for one month only, about 1%. Prediction markets tell us how likely these events are, not how strongly gas buyers would react to them; that part comes from the model.
The gas futures market sees a calmer winter. On 9 October the winter months traded at about €80, a little below the model’s path with no new surprises (€88 in January). Futures reflect an average over everything traders think can happen; the model’s paths, averaged with the market probabilities, give about €165 in January. Part of the gap comes from how the scenarios are built: they add new shocks on top of what is already expected, and a stalemate that everyone sees coming is probably already in today’s price. If we assume that the market has already priced in the stalemate, the average falls to about €135, and the rest of the gap comes from the war path. There are three possible readings. Gas traders may think a severe war less likely than prediction markets do. They may expect a new war to trigger less precautionary buying than March did, for instance because much of that buying has already been done since August. Or the model may overstate how much precautionary buying moves the price.
What to watch
- Storage. If injections stay above their usual pace at these prices, the market is still buying against a shortage. If they slow while the price stays high, gas is getting scarce.
- LNG arrivals in late October and November, when any physical effect of this week’s attacks would reach Europe.
- The odds of new US strikes after the midterm elections of 3 November.
- Official monthly data (JODI) for August, due around 22 October, and the full October data in early November.
So far, Europe is paying for gas it fears losing more than for gas it has lost. If that holds, the next move in the price will show in storage and in the odds of the conflict before it shows at the terminals.
About the data and the model
- The model covers the EU gas market monthly from 2014 to July 2026, with six series (pipeline gas and domestic production, euro-area manufacturing, the real gas price, gas in storage, LNG imports, consumption), estimated with the Bayesian methods of Baumeister and Hamilton (2015).
- For August, September and early October, it is fed the four series already observed (price, storage, LNG send-out, pipeline imports) and asked which shocks reproduce them, in the spirit of Antolín-Díaz, Petrella and Rubio-Ramírez (2021). Adding early estimates of August consumption and output gives the same reading.
- The model’s price is the World Bank’s European gas price, in dollars, deflated by euro-area consumer prices. Euro figures use September 2026 prices and exchange rate, so they can differ from TTF quotes by a few percent: February 2026 is €34 in these terms, against an average TTF of €32. The euro fell 2.5% against the dollar in early October, so October’s rise is smaller in the model’s dollar terms (about 3%) than in euros (about 6%).
- The scenarios are what-if paths, not forecasts; their ranges reflect uncertainty about the model’s parameters only. Their cargo losses are scaled to the LNG shock of March, when few cargoes were yet missing; scaled to July’s, the largest shortfall so far, the war path would reach about €392 in January instead of €318. Market odds are prices on 10 October 2026; the weights on the scenarios are my judgement. Event dates are from news reports and the markets’ own rules.
Data: Gas Infrastructure Europe (AGSI+ and ALSI), ENTSOG Transparency Platform, World Bank Commodity Price Data, Eurostat, JODI, ECB, Trading Hub Europe, Open-Meteo, IMF PortWatch, Polymarket, Kalshi; Gassco nominations and TTF prices and futures from LSEG.
Sources
- Financial Times (2026). Oil tanker captains paid $100,000 a month for perilous Hormuz voyages. 7 October 2026.
- Reuters (2026). Hormuz transits at lowest in over two months after attacks, data shows. 8 October 2026.
- Bloomberg (2026). Qatar’s Ras Laffan LNG plant hit by missile, extensively damaged. 18 March 2026.
- World Oil (2026). Ras Laffan attacks could reshape global LNG supply as outage timeline extends. 20 March 2026.
- IMF PortWatch (2026). Daily transit calls, Strait of Hormuz. Accessed 10 October 2026.
- Kalshi (2026). Strait of Hormuz transit calls back above 60 (KXHORMUZNORM). Accessed 10 October 2026.
- Polymarket (2026). Strait of Hormuz traffic returns to normal by December 31? and related markets. Accessed 10 October 2026.
- Antolín-Díaz, J., I. Petrella and J. F. Rubio-Ramírez (2021). Structural scenario analysis with SVARs. Journal of Monetary Economics, 117, 798-815.
- Baumeister, C. and J. D. Hamilton (2015). Sign restrictions, structural vector autoregressions, and useful prior information. Econometrica, 83(5), 1963-1999.